See current SpO2 and heart rate readings with timestamps pulled from the Health app.
Health trends from your device
OxiTicker
View recent blood oxygen saturation (SpO2) and heart rate readings from the Health app with clear latest measurements, lightweight trend charts, minimum and maximum values, a 24-hour average, and a configurable multi-day average.
This app is not a medical device. Consult a healthcare professional for medical advice.
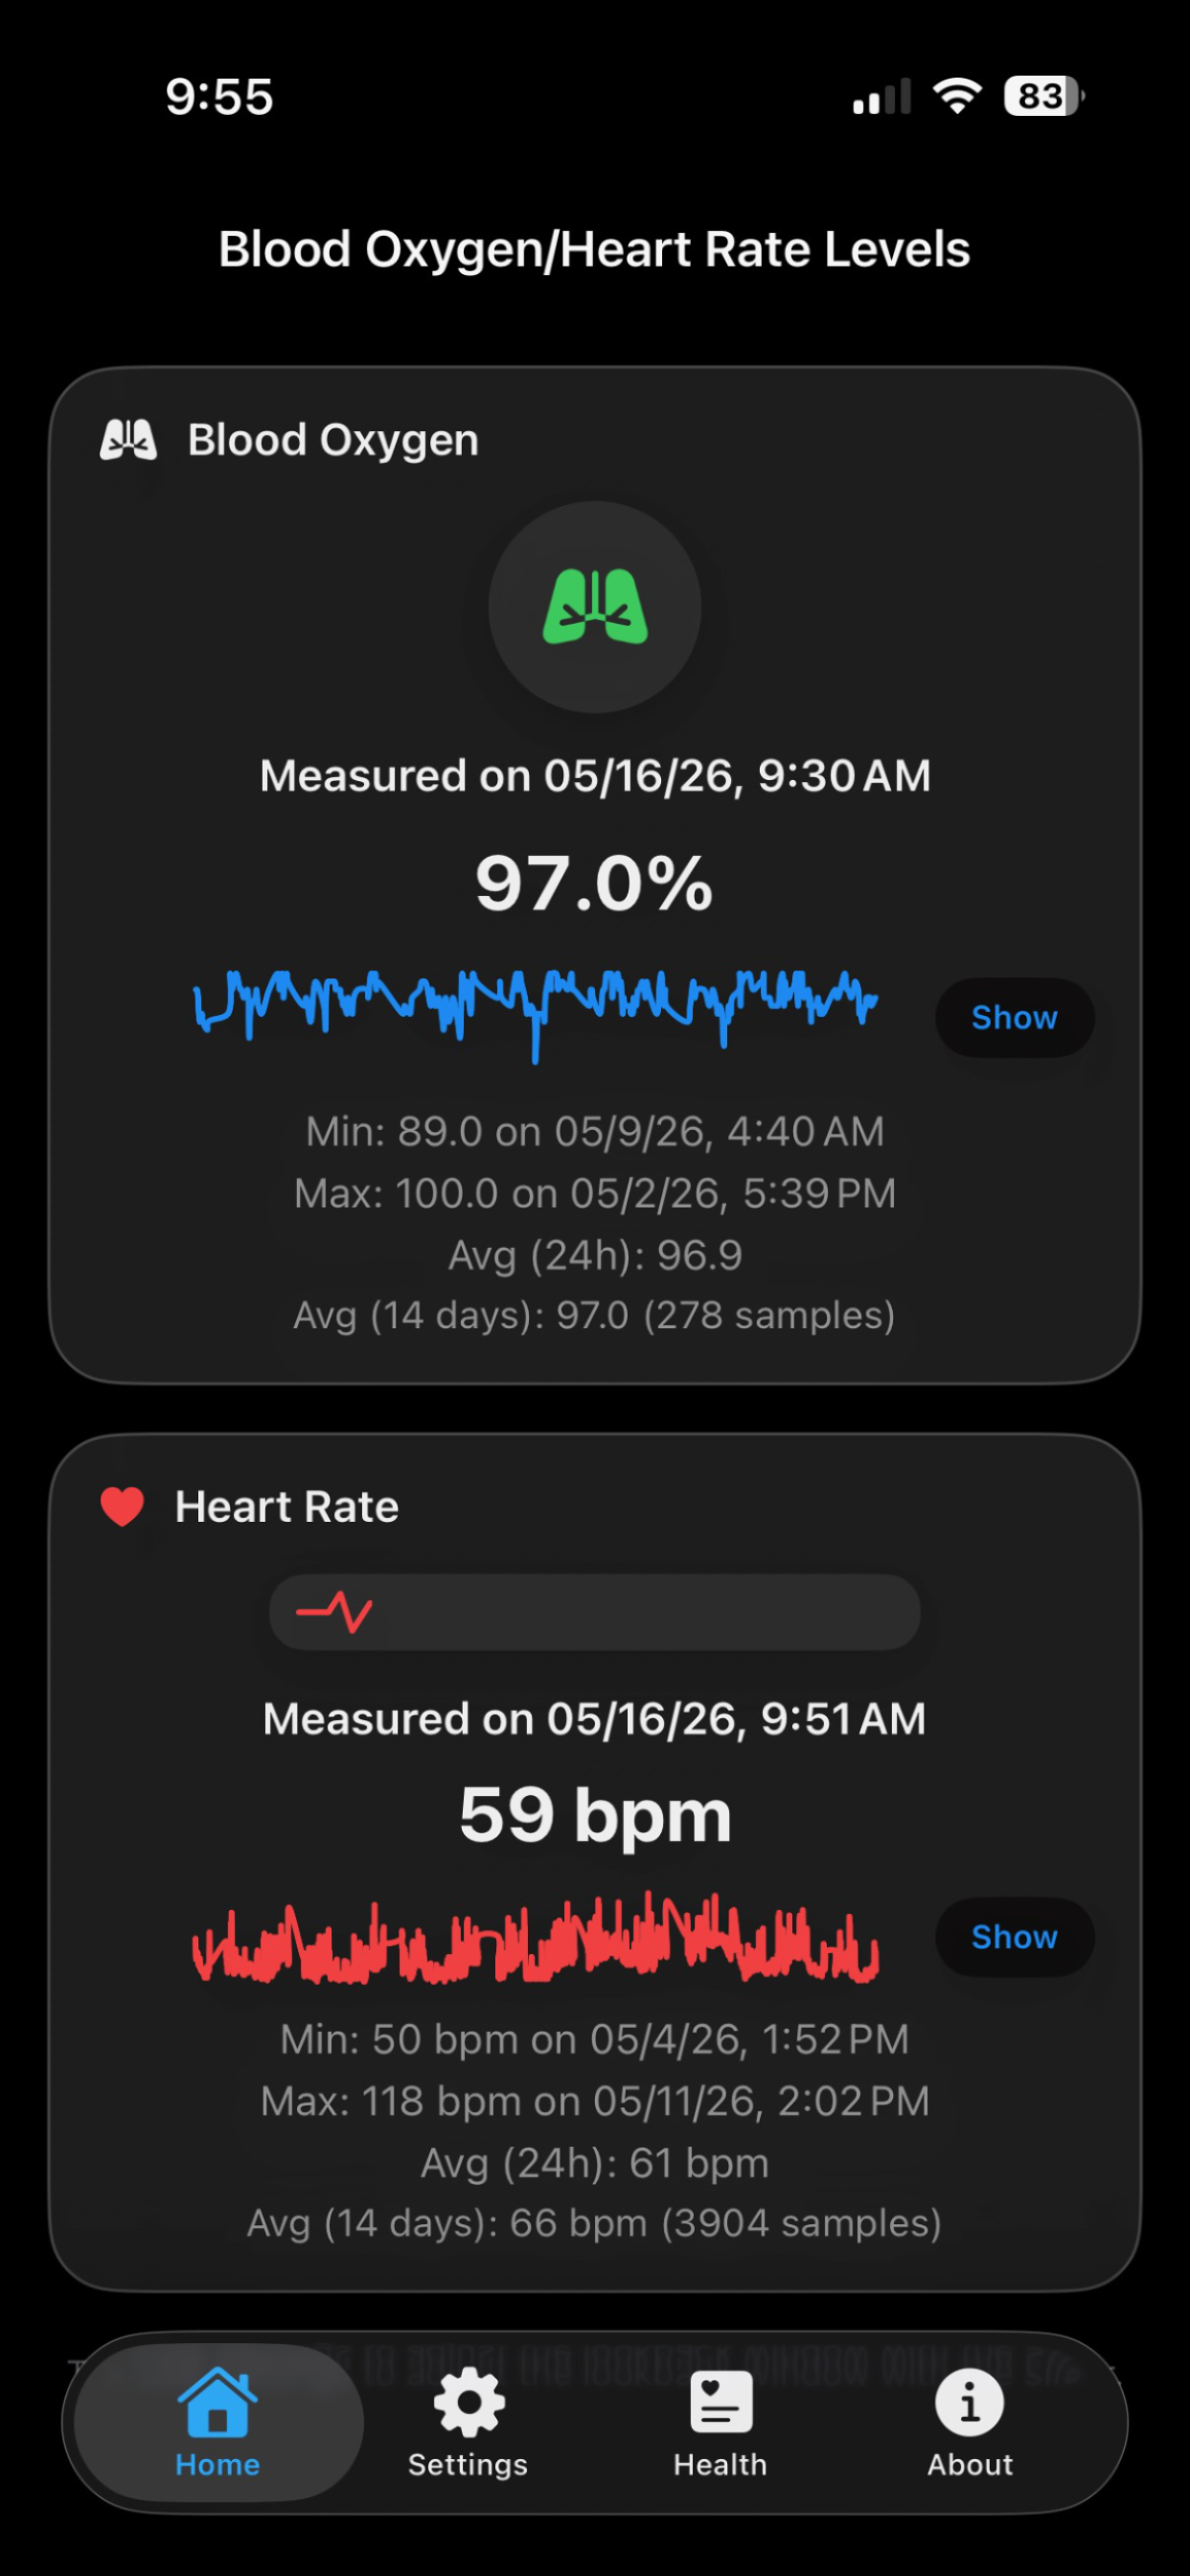
Fast, focused readings.
OxiTicker keeps the dashboard compact and readable, while giving recent trends enough room to make changes easier to spot.
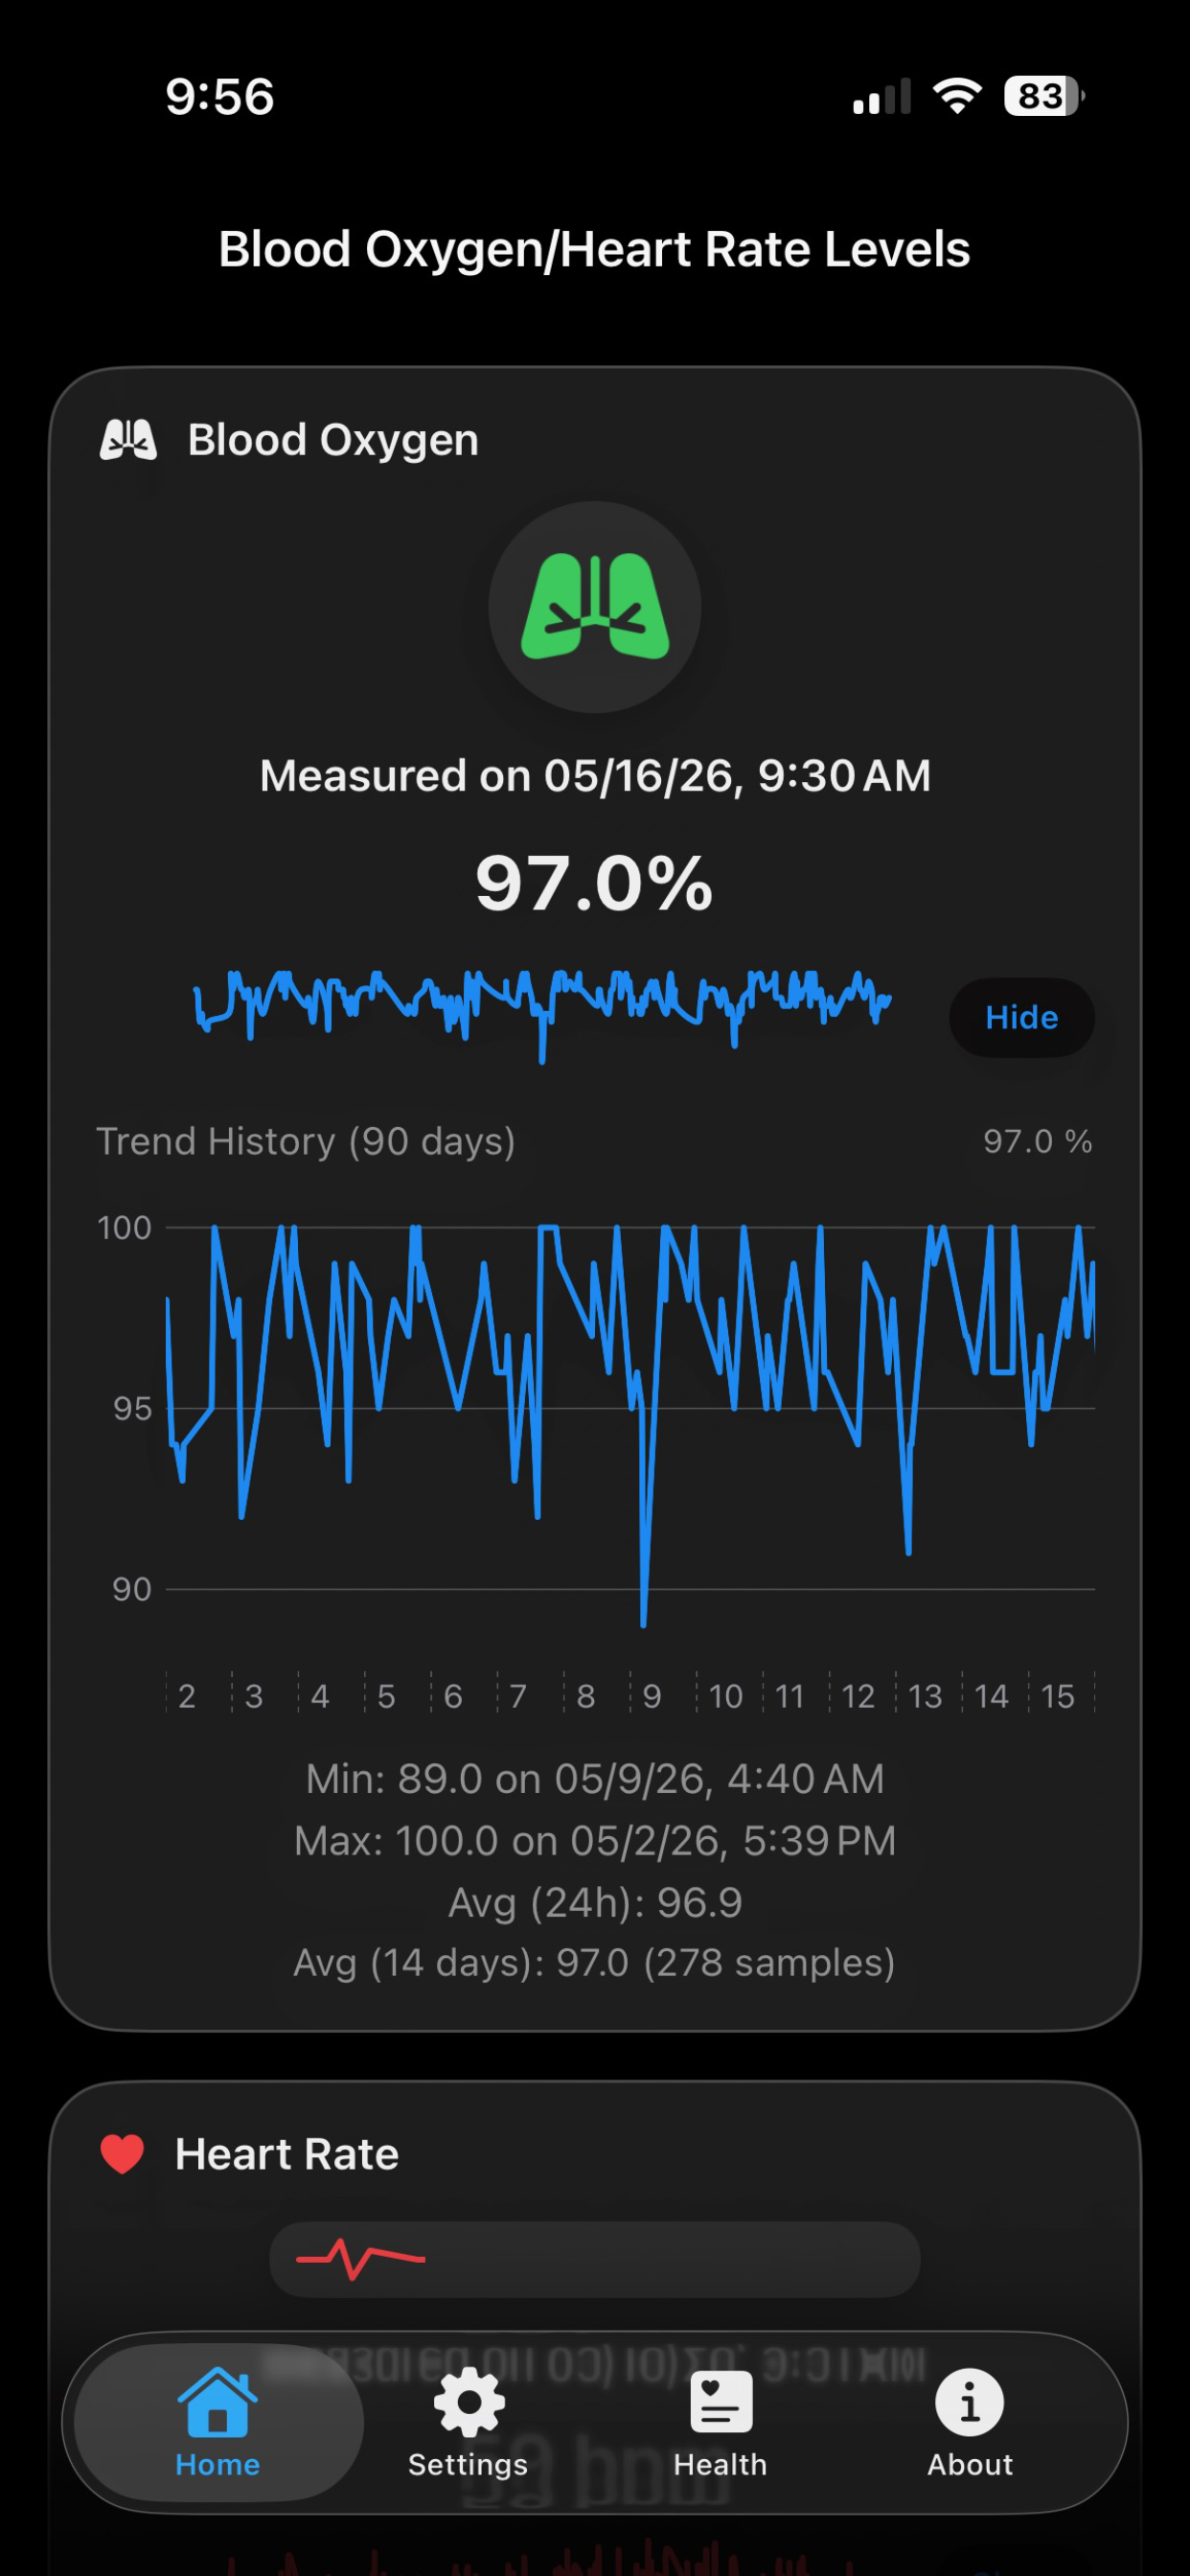
Show trend charts for SpO2 and heart rate that scale with your selected lookback window.
Review min, max, 24-hour average, and multi-day average values over your chosen time range.
Pull to refresh and use automatic background updates to keep recent readings close at hand.
Subtle breathing lungs animation and a compact EKG sweep make each card feel alive without getting in the way.
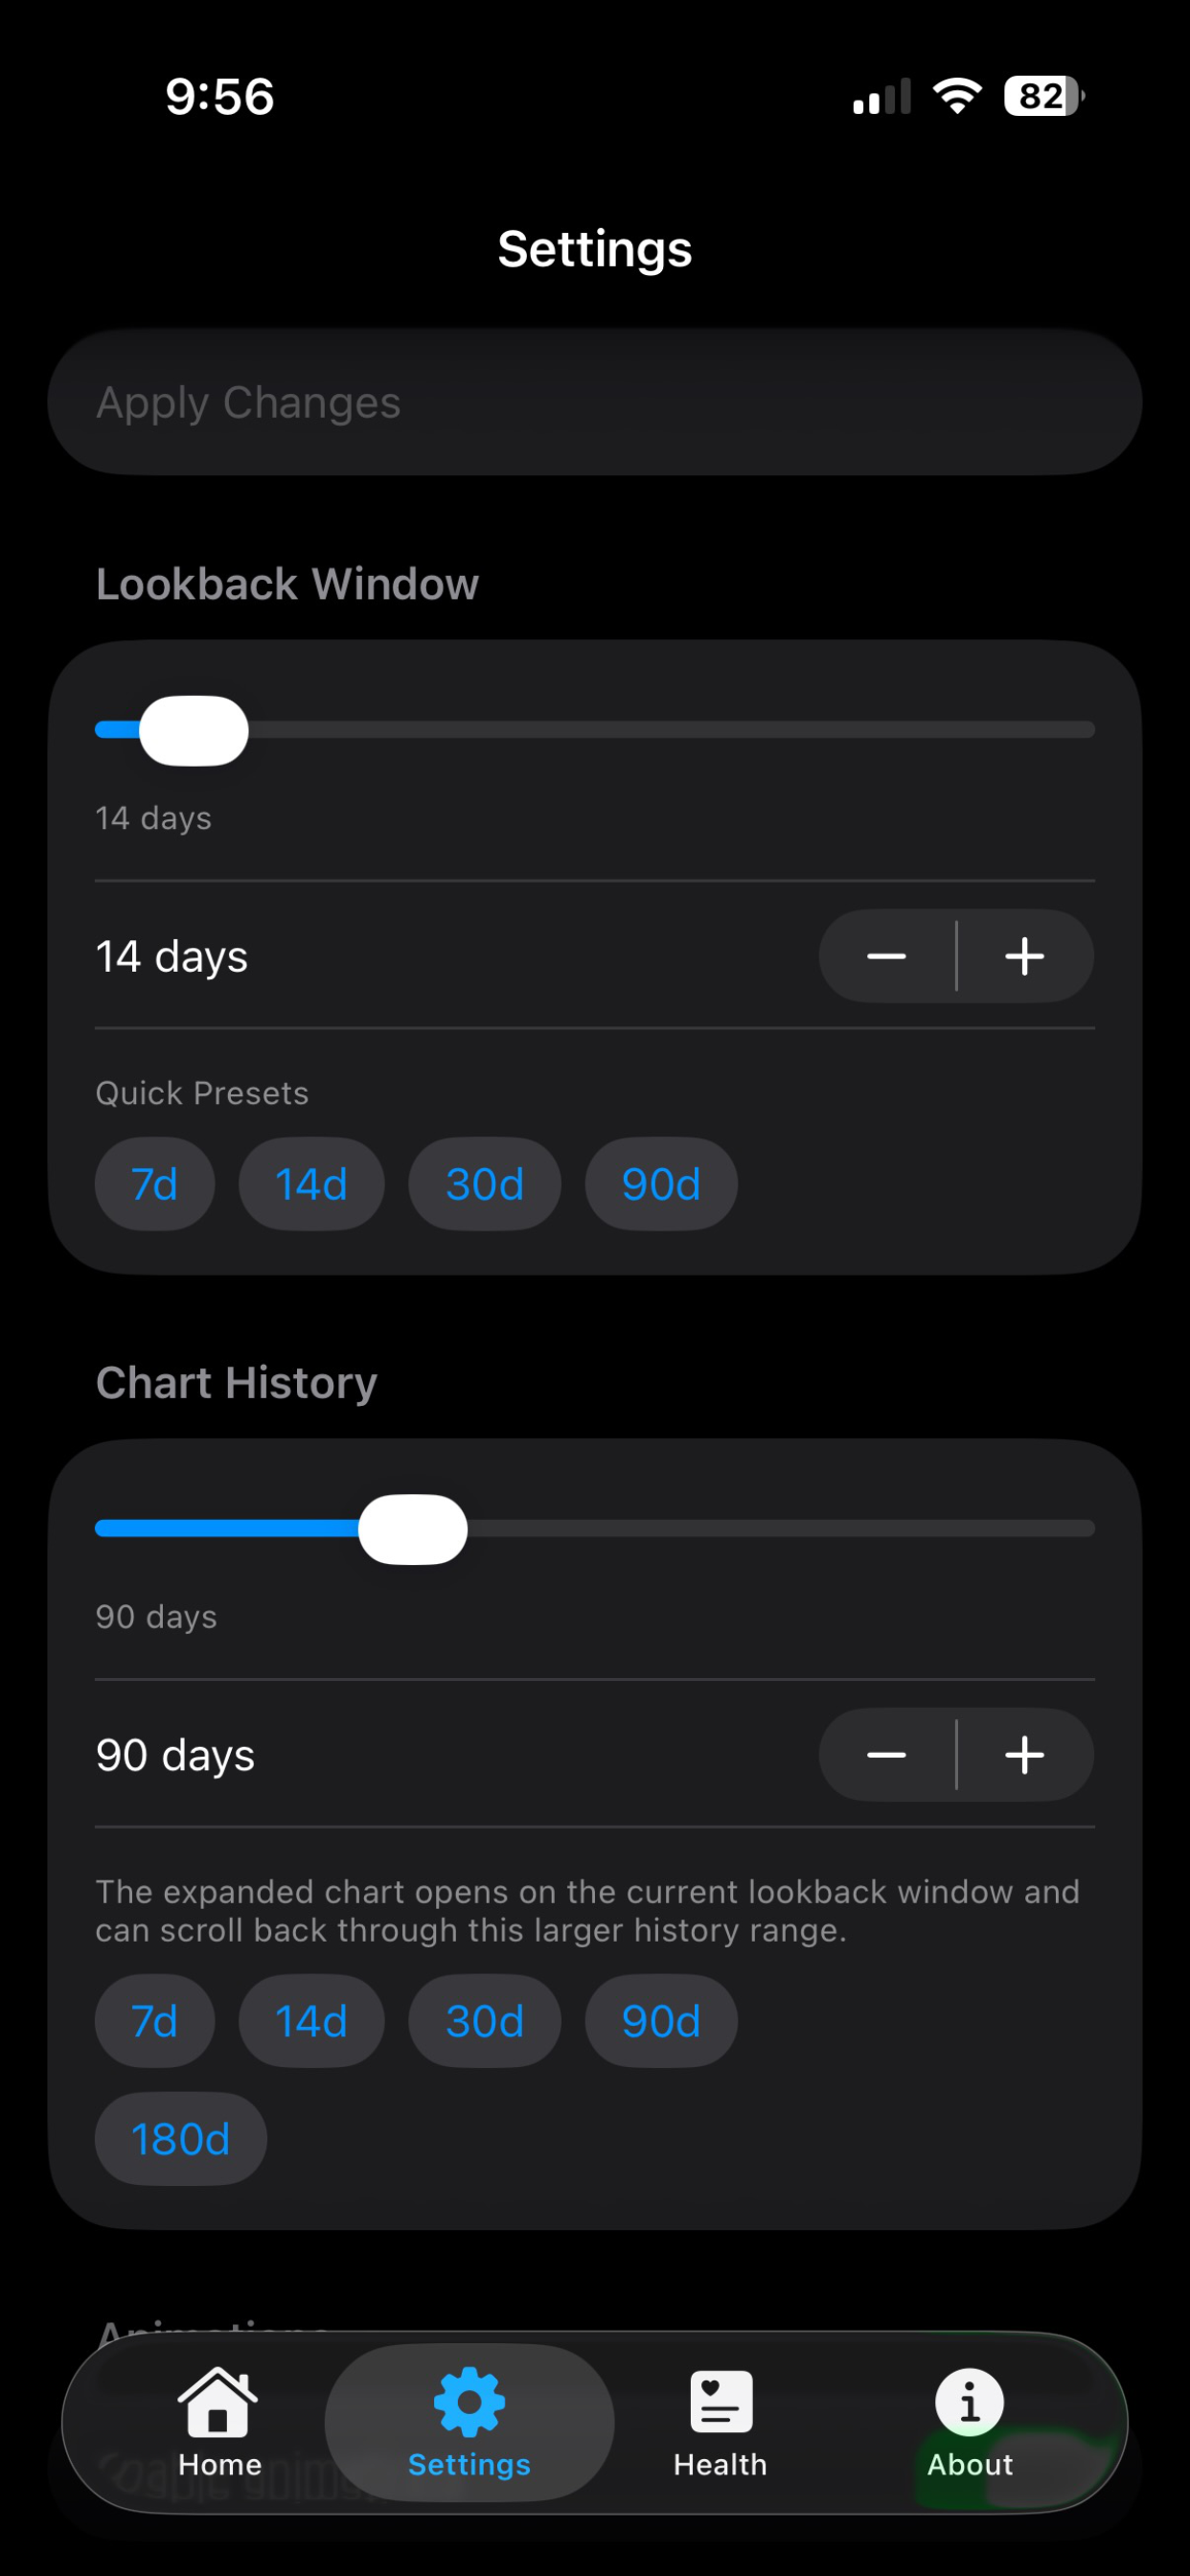
Use the Settings tab to choose the lookback window that fits how you track your health data.
Built for quick checks.
The app uses a dark dashboard, direct labels, and high-contrast charts so key readings stay easy to scan.
Your data stays on device.
With your permission, OxiTicker reads recent Health app measurements and presents them in a lightweight dashboard. It is designed for personal tracking, not diagnosis or medical decision-making.